Building a Voronoi Map with D3 and Leaflet
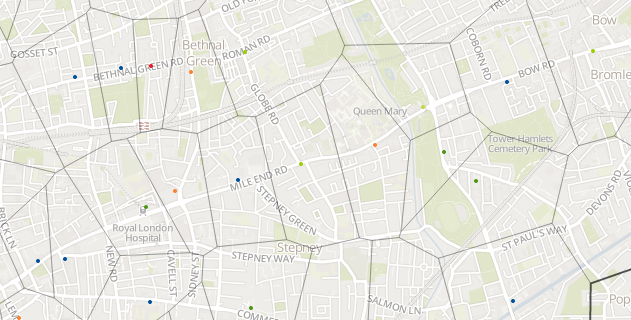
Here I explain how I used D3 with the mapping library Leaflet to help visualise the locations of supermarkets in the UK, to produce something like this:
If you want to find out more about Voronoi diagrams you can read my write up on visualising supermarkets with a Voronoi diagram.
Setting up the map
L.mapbox.accessToken = 'pk.eyJ1IjoiemV0dGVyIiwiYSI6ImVvQ3FGVlEifQ.jGp_PWb6xineYqezpSd7wA'
map = L.mapbox.map('map', 'zetter.i73ka9hn')
  .fitBounds([[59.355596 , -9.052734], [49.894634 , 3.515625]]);
Here I’m creating a new map to put in the element with the id of map with the custom Mapbox layer zetter.i73ka9hn. I wanted to use one of the free map tile servers provided by Open Street Map but found that the bright colours on the map made the overlay hard to see. Mapbox makes it easy for you to build your own map tiles from Open Street Map data by choosing which map features to display and how they should look. The Mapbox js library is the Leaflet js library with a few additions to make working with Mapbox tiles and other Mapbox data easier.
Loading the data
var points = [];
d3.csv(url, function(csv) {
  points = csv;
})
This code uses D3 to turn a CSV file into javascript objects for you to work with. If you had the CSV:
location, company
Whitechapel, Sainburys
Bethnal Green, Tesco
Then points would be populated with:
[
  {location: 'Whitechapel', company: 'Sainburys' },
  {location: 'Bethnal Green', company: 'Tesco' }
]
Adding our layer
I drew the points and Voronoi diagram onto a new layer above the base map.
var mapLayer = {
  onAdd: function(map) {
    map.on('viewreset moveend', drawLayer);
    drawLayer();
  }
};

map.addLayer(mapLayer);
To Add a layer with Leaflet we can call addLayer with an ILayer object. This needs to at least implement onAdd which is called by Leaflet after you add the layer. By hooking on the viewreset (triggered when zoom changed) and moveend (triggered after the map is moved) events we make sure the layer is redrawn when it needs to be.
Filtering and Projecting
The more points we have, the more time the points and Voronoi diagram will take to draw. So we don’t waste time drawing things we cannot see, we filter the data points to those that are in, or close to1, the part of the map that is currently displayed.
var bounds = map.getBounds();
var drawLimit = bounds.pad(0.4);

var filteredPoints = points.filter(function(p) {
  var latlng = new L.LatLng(p.latitude, p.longitude);
  return drawLimit.contains(latlng);
);
Our data has latitude and longitude data for the position of each supermarket. To be able to draw these points on our layer we have to project them onto x-y pixel coordinates, so for the latlng of every filtered data point:
var point = map.latLngToLayerPoint(latlng);The D3 voronoi function doesn’t work when it’s given multiple points with the same x-y coordinate2 so after projecting we must also filter to unique x-y coordinate pairs.
Drawing the points
This shows off one of the more interesting features of D3. Normally when manipulating the DOM with a library such as jQuery you would build one element at a time in a loop. D3 allows you to ‘join’ DOM manipulation to the data set to multiply any operation to multiple elements.
var svgPoints = svg.selectAll("g")
  .data(filteredPoints)
  .enter()
  .append("g")

svgPoints.append("circle")
  .attr("transform", function(d) { return "translate(" + d.x + "," + d.y + ")"; })
  .attr("r", 2);
Here we first join to our dataset with data(filteredPoints) and then call enter to tell D3 that any subsequent operations should be performed for every object in filteredPoints. So now when we call .append("g") a new SVG <g> node is added for every point in our dataset. Any more operations that we chain on this will also be multiplied out such as calling .append("circle") and setting attributes on it for every point we want to draw on our map. When a function is passed to attr, the function is called for every object in out dataset to generate the value set.
Mike Bostock, the creator of D3, has written a great post that explains more about joins.
Drawing the Voronoi paths
D3 provides a voronoi function that creates Voronoi cells from an array of points. There is some plumbing we have to do to be able to use this. First we create our own voronoi function that knows how to get the x-y coordinate for any point passed into it:
var voronoi = d3.geom.voronoi()
  .x(function(d) { return d.x; })
  .y(function(d) { return d.y; });
Then we build the voronoi cells. voronoi returns an array of cells, each with a reference back to the point it was constructed from. We loop over them to give each point a reference to the cell since points are the dataset we are working from:
voronoi(filteredPoints).forEach(function(v) { v.point.cell = v; });Last we build a function that formats a array of coordinates that makes up a cell into a string that represents an SVG path. Then we can append all the paths to our SVG:
var buildPathFromPoint = function(point) {
  return "M" + point.cell.join("L") + "Z";
}

svgPoints.append("path")
  .attr("d", buildPathFromPoint);
The Result
For me this was great chance to use D3 and Leaflet. Both libraries are well-documented and a pleasure to use. I found that D3 does take a bit of getting used to because of the breadth of features it offers and the unusual way that joins effect method chaining.
You can see all the code on github and play with the finished result. It should be easy to use the same code to display any dataset which contains latitude and longitude coordinates on a map.
References
There were two examples of using D3 by Mike Bostock that were great references when building this:
The map layer of the visualisation on this page is copyright Mapbox and OpenStreetMap.
This tutorial was updated on 2015-07-10 to be compatable with v4 of the Mapbox web API.
-
Points that are just outside the map won’t themselves visible but could produce a Voronoi cell that is in the current view. ↩
-
From the D3
voronoidocumentation: “If any vertices are coincident … the behavior of this method is undefined: most likely, invalid polygons will be returned! You should filter invalid vertices, and consolidate coincident vertices, before computing the tessellation.” ↩
You can read more by me, follow me on Mastodon or subscribe.

I've just published my book - Build a Database Server. Learn how real databases like PostgreSQL and MySQL work by building your own database from scratch.
Find out more and see a preview.